Calculating Expected Value of Options at Seed, Series a, and Series B
Multiply exit odds by conditional payouts to find what equity actually deserves.
An engineer looks at a term sheet, sees a grant number, and hears a recruiter walk through what it could be worth if the company sells for some big, round figure. That conversation almost always stops at one number: the conditional payout, or what the grant is worth if a specific, optimistic exit actually happens. The conditional payout is a real calculation. It multiplies ownership percentage by exit value, subtracts what dilution and the preference stack take off the top, then subtracts strike price and taxes. The second number it leaves out is the probability that the exit scenario happens. Expected value takes that conditional payout and multiplies it by the odds of the scenario materializing, and that second multiplication is the step recruiter pitches skip almost every time. The two numbers, conditional payout and true expected value, can differ by an order of magnitude. That gap is the dominant variable in the calculation, and every stage-specific estimate that follows in this piece is built on getting that second number right.
The four inputs that move materially between stages
The same expected-value formula produces wildly different results depending on when an engineer joins, because four inputs shift in predictable directions as a company ages: valuation, grant size, cumulative dilution, and the preference stack.
Valuation sets the denominator for ownership percentage and anchors the conditional payout calculation. It rises at each successive funding round, which compresses the percentage any new hire receives for the same dollar of perceived contribution. PitchBook-NVCA data for Q1 2026 puts seed pre-money valuation at a median of $18.4 million. By Series A, the non-AI median sits at $42.4 million while the AI median climbs to $78 million. By Series B, non-AI companies post a median of $174 million against $270.8 million for AI companies. The AI premium doesn't just persist with stage, it widens, so an engineer evaluating a Series A offer has to know whether the company is classified as AI or non-AI before the valuation figure on the table means anything.
Grant size moves the opposite way from valuation: it shrinks as both hire order and stage advance. Across more than 8,000 initial grants, Carta data shows the median grant for an employer's first hire at 1.49%, dropping to 0.50% for the third hire and 0.33% for the fifth. That drop isn't a sign of declining opportunity so much as a reflection of falling risk and rising valuation: a 0.5% grant at seed and a 0.1% grant at Series A can land at similar expected dollar outcomes for the same eventual exit, because what matters is the valuation at the moment of grant, not the percentage sitting alone on a cap table summary.
Cumulative dilution compounds quietly across every financing round, and it is reliably worse than the headline percentage on an offer letter suggests. Option pool top-ups get set pre-money at each round, so the dilution from refreshing that pool falls on founders and existing employees.
The preference stack adds a different kind of cost. Every financing round stacks a new layer of preferred stock ahead of common shareholders, which is what employees hold. By the time a company has raised through Series B, that aggregate liquidation preference can be substantial, and common doesn't see a dollar until it clears. Participating preferred behaves like a flat tax on the common stack at every exit above the preference floor, one that does not fade as the exit gets bigger, which makes the arithmetic harsher still. The worst version of this structure is participating preferred with a high multiple: at an exit that merely equals the post-money valuation, the preference alone can consume all the proceeds, leaving common with nothing.
Calculating EV at seed: high grant, low survival, long wait
Seed-stage grants look the most generous of any stage, and in percentage terms, they are. The problem for the math is that the probability of any meaningful exit at seed is small, and the time required to even find out stretches longer than it used to. A 0.5% grant at a $10 million seed post-money is worth $50,000 on paper at the moment of grant. By Series A, with the company now valued at a $50 million post-money and roughly 25% cumulative dilution, that same stake has thinned to about 0.38%, worth roughly $190,000. By Series B, at a $150 million valuation and about 20% further dilution, it is roughly 0.30%, worth roughly $450,000. At a $500 million exit, the stake has worn down to about 0.24%, worth roughly $1.2 million, and that's before the preference stack takes its share. Those numbers track the conditional payout climbing steadily as the company succeeds, which is exactly the version of the story a recruiter tells.
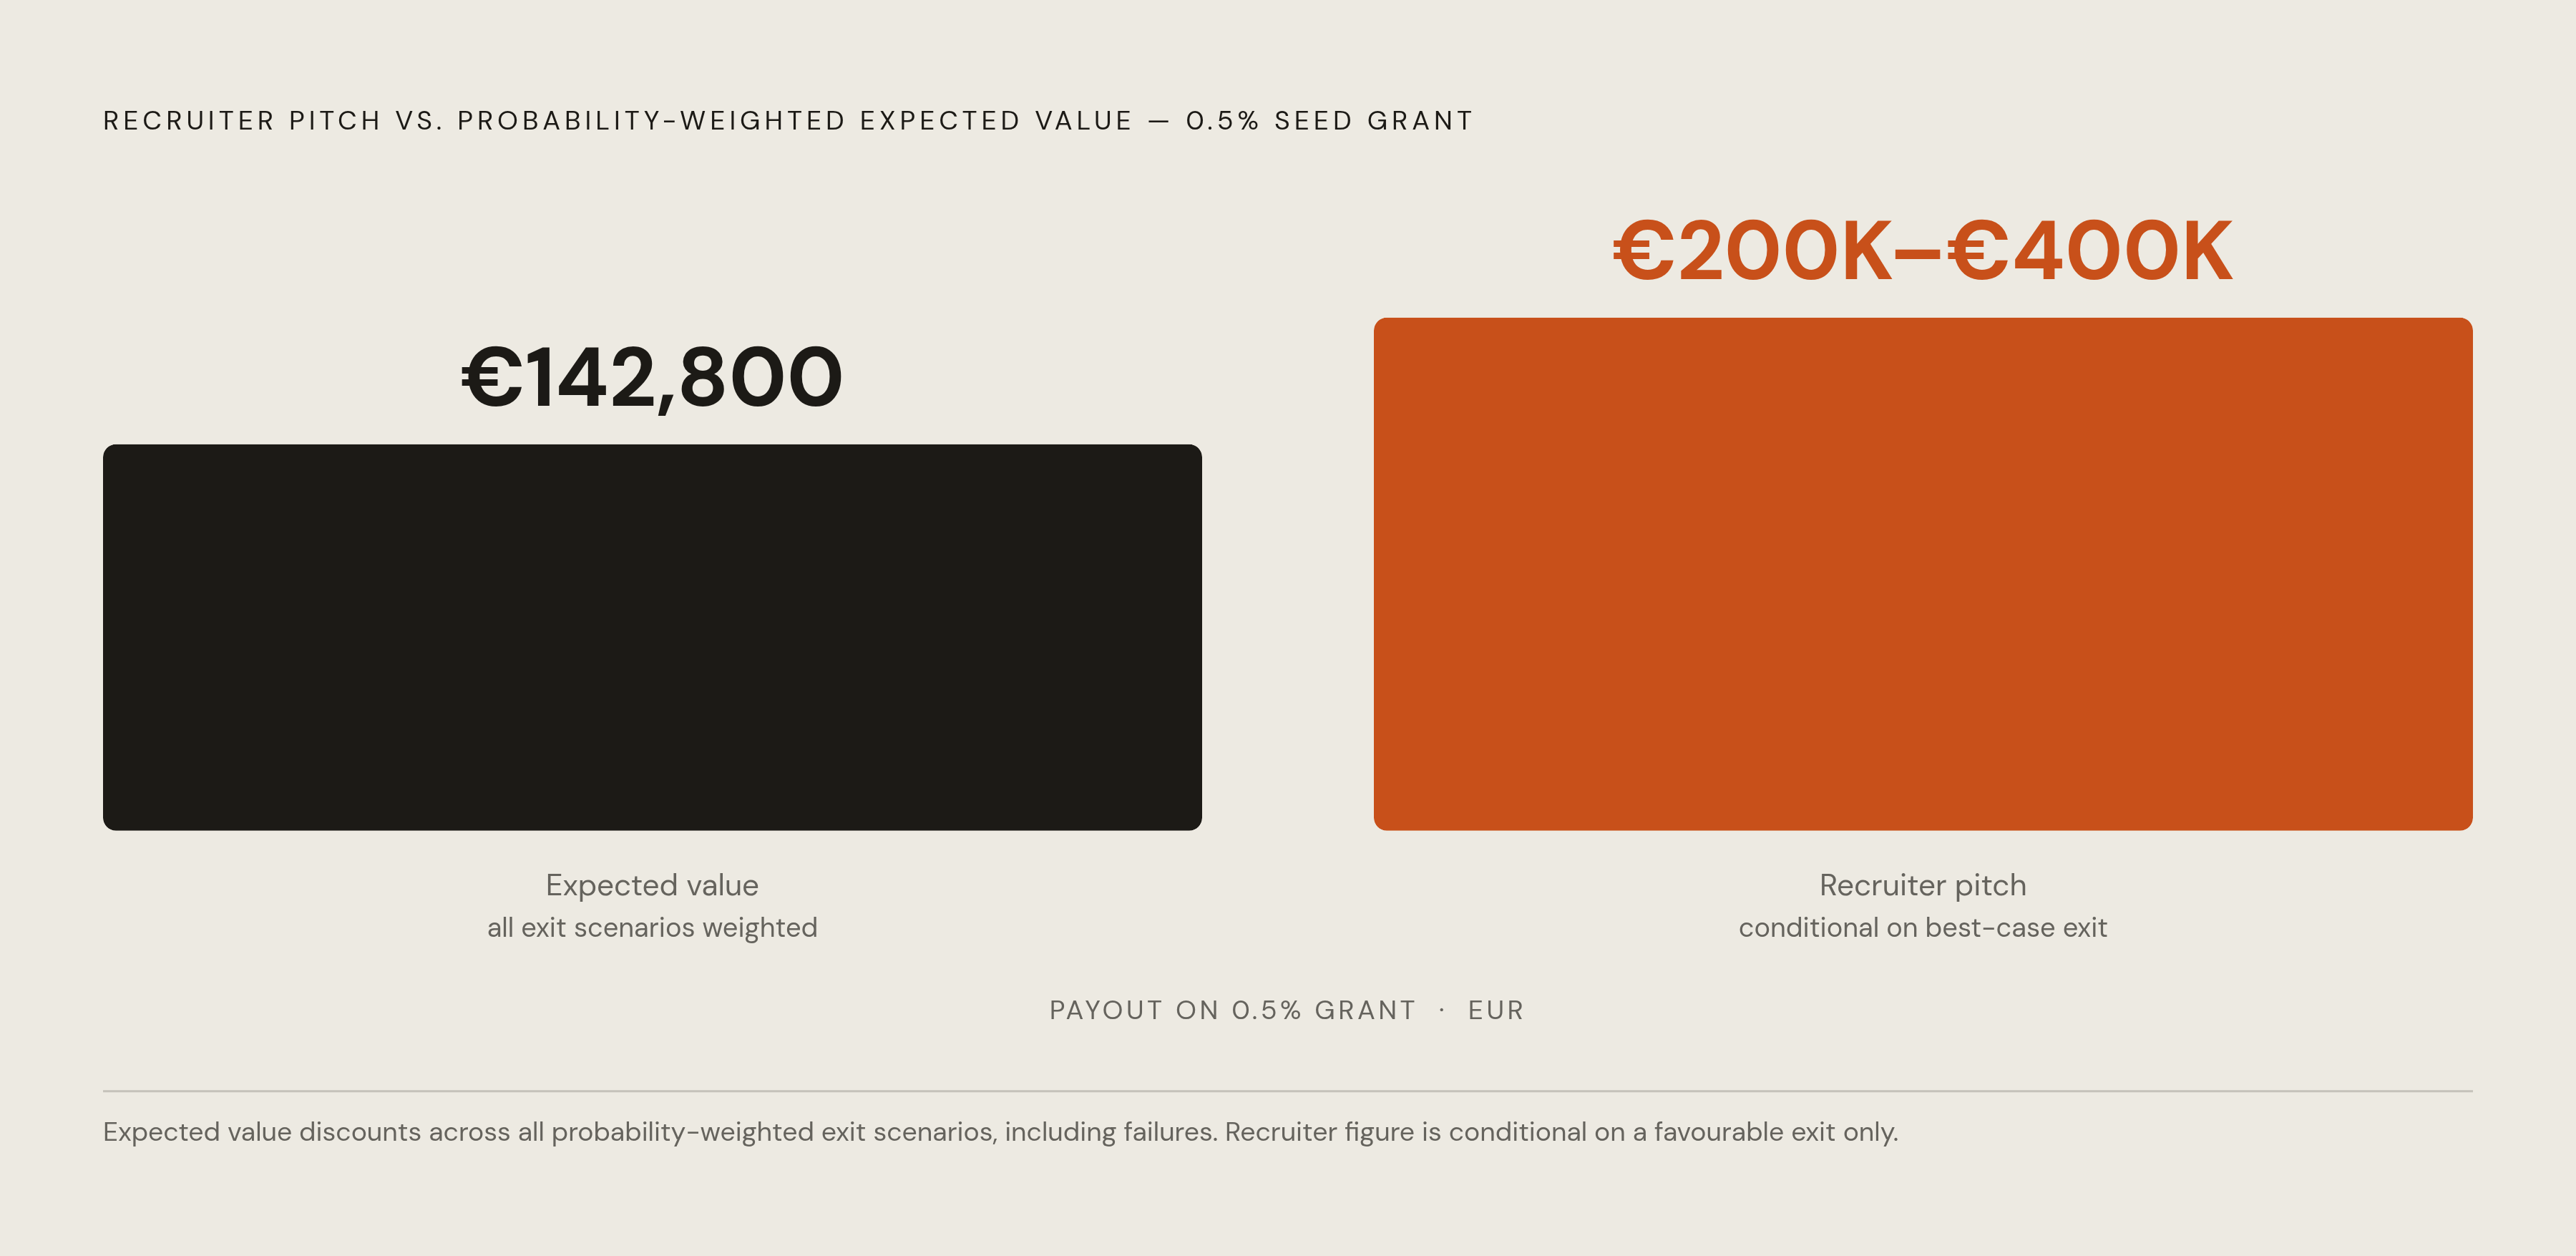
The expected-value version tells a different story. Running that same 0.5% seed grant through a full range of exit scenarios, weighted by the honest probability of each one happening, produces a probability-weighted expected value of roughly €143,000 total, close to €142,800 precisely. Compare that to a recruiter pitch anchored on a preferred exit value of €200,000 to €400,000; that gap is the entire point of this calculation. The conditional payout describes one branch of a tree. It describes the whole tree, weighted by how likely each branch actually is.
You can run this honestly at seed if you take three steps before you compare anything. First, estimate the conditional payout at two or three exit scenarios, a modest outcome, a strong outcome, and a generational outcome, each one net of dilution and the preference stack. Second, you assign survival-weighted probabilities to each of those scenarios that reflect the real odds a seed-stage company reaches them, not the odds implied by the recruiter's favorite comparable. Third, sum the probability-weighted payouts across all three scenarios and compare that sum to the salary an engineer gives up by taking the equity-heavy offer.
One factor most calculators leave out entirely: the option to quit. If a seed-stage company stalls, an engineer isn't locked in. Leaving and redeploying elsewhere has real value, and that optionality partially offsets the illiquidity a seed grant demands in exchange for its size. What should actually drive the decision isn't the modal outcome, the outcome a company is most likely to hit, but the ceiling. A 0.5% grant in a company with a genuine shot at a generational exit is worth dramatically more than the same 0.5% in a company likely to top out around $50 million, and the difference has nothing to do with the percentage on the cap table. It comes entirely from how the conditional exit distribution is shaped above the median case.
Calculating EV at Series A: where the AI premium splits the math in two
By Series A, you can no longer evaluate an offer with a single label. A Series A grant from an AI company and a Series A grant from a non-AI company in 2026 require separate expected-value calculations, because the valuation inputs, the grant sizes, and the realistic exit distributions no longer line up with each other.
The valuation gap is the clearest evidence of that split. PitchBook-NVCA data puts the AI median Series A pre-money at $78 million against $42.4 million for non-AI, a premium of roughly 84%. That gap doesn't close with stage, it widens: by Series B, the AI median reaches $270.8 million against $174 million for non-AI. A higher entry valuation at Series A means a higher strike price on any options granted there, and a higher strike price raises the exit multiple the company has to clear before those options are worth exercising. If an AI company is priced at $78 million pre-money, it needs to reach a meaningfully higher eventual exit than a non-AI company priced at $42 million just to give an employee holding options the same per-share gain.
Dilution works slightly in the engineer's favor at this stage. Median Series A dilution in 2026 is 18.7%, the lowest level in several years. Engineers joining at Series A now are giving up less percentage per subsequent round than cohorts who joined back in 2021 or 2022. That's a real improvement in the math, even as valuations climb.
The preference stack, meanwhile, has stopped being theoretical by Series A. A company that has closed a seed round and a Series A carries at least two layers of preferred stock ahead of common. If either round included participating preferred terms, the common stack takes a haircut at every exit below the combined preference amount, not just at a catastrophic one.
A worked example shows how all four inputs net out together. A 0.05% grant at a $100 million Series A valuation, diluted through a Series B round, a Series C round, and an eventual IPO at a $3 billion valuation, ends up around 0.028% of the company, worth approximately $840,000 before exercise costs and taxes. That's a meaningful number, and it's also a number that depends entirely on the company clearing a long sequence of rounds successfully.
Before signing a Series A offer, three questions reveal whether that $840,000-style outcome is realistic or theoretical. Is the preferred stock participating or non-participating? What is the aggregate liquidation preference already sitting on the cap table from prior rounds? And what exit multiple does the company need to clear those preferences before common shareholders see any proceeds? Once you know those three answers, and whether the company sits in the AI or non-AI valuation band, you can turn a generic Series A offer into a specific, calculable bet.
Calculating EV at Series B: lower risk, higher strike, preference stack at full weight
Series B equity carries the highest survival probability of the three stages covered here, and also the highest strike price and the fullest preference stack. That combination means the conditional payout at a merely good exit can land close to zero even in a company that, by any reasonable definition, succeeded.
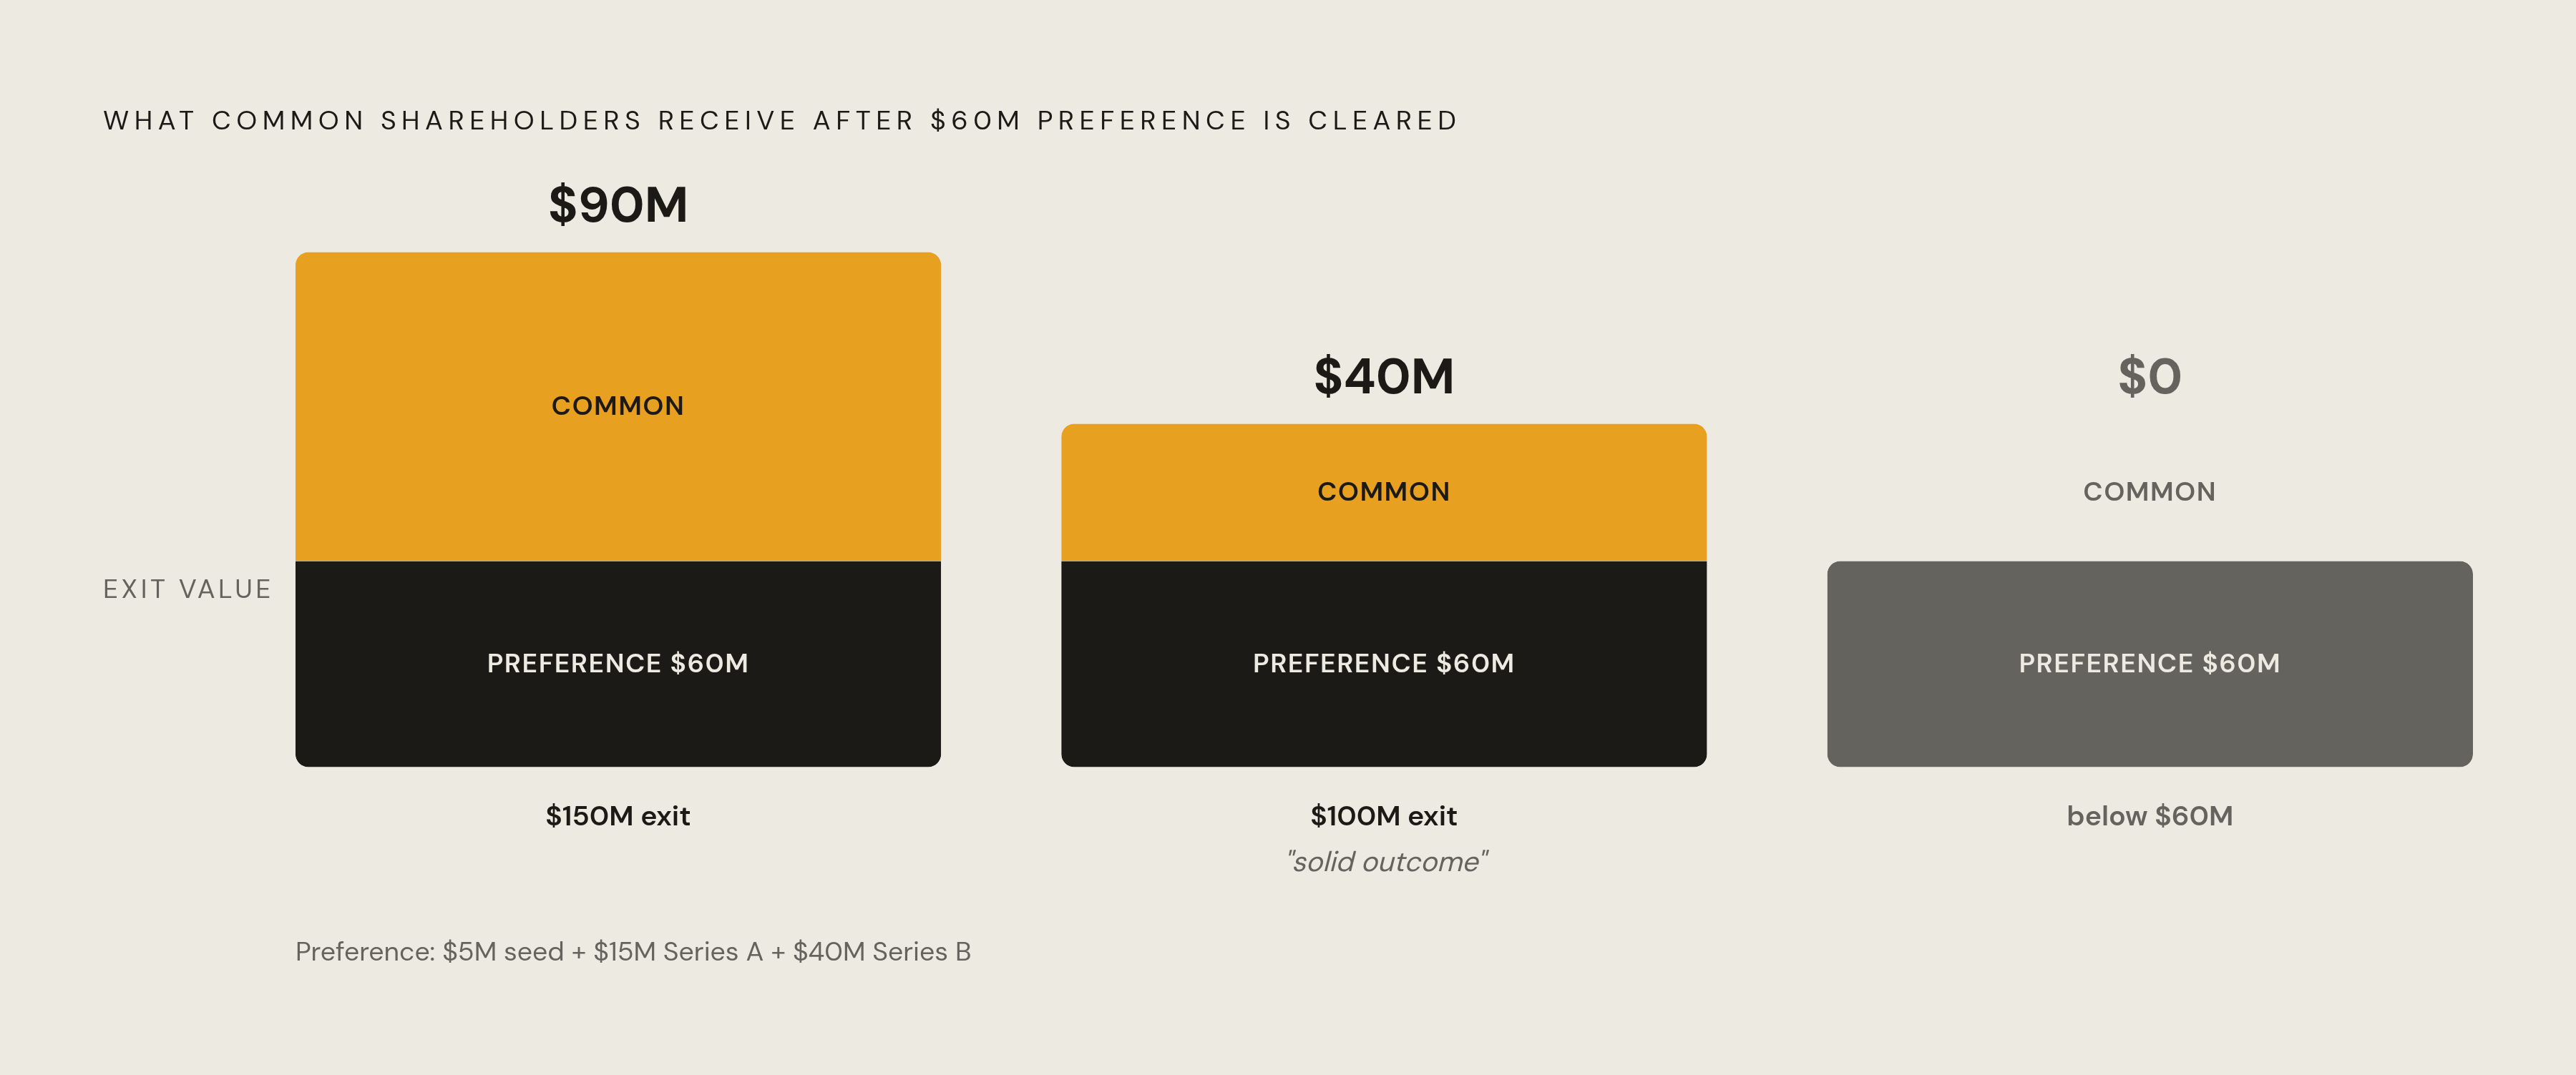
The exit multiple required to clear the preference stack by this stage is substantial. If a company raised $5 million at seed, $15 million at Series A, and $40 million at Series B, it has layered up $60 million of aggregate liquidation preference standing ahead of common shareholders. At a $150 million exit, a genuinely solid outcome by most measures, common splits just $90 million across every common share outstanding. At a $100 million exit, common splits just $40 million. Below $60 million, common receives nothing at all, regardless of how hard the team worked to get there. Participating preferred makes this worse still: if any round in that stack carries participation rights, the preference recaptures additional dollars at every exit above the floor, shrinking the common pool further than the non-participating math alone would suggest.
The strike price compounds the problem from the other direction. Options granted at Series B are priced off a 409A valuation that reflects the company's higher post-money, so the company now has to exit well above that already-elevated valuation before those options generate a meaningful gain for the person holding them.
Grant sizes shrink to match. Individual contributors joining at Series B get grants that are a fraction of what seed-stage hires received, and their dollar value depends almost entirely on the company reaching a large exit. A moderate outcome, the kind that would have meant a solid payday at seed, may barely move the needle on a Series B grant once the preference stack and the strike price are both accounted for.
The exercise decision gets more expensive too. A higher 409A means a higher strike price per share, and exercising a meaningful Series B grant at departure can require a substantial cash outlay, all of it due within the standard 90-day post-termination window most option grants carry.
The expected-value formula still works at Series B, but it needs one explicit adjustment: the probability weight assigned to survival is more favorable than at seed or Series A, yet that favorable probability means little without running the preference waterfall directly. Modeling what common actually receives across a range of exit multiples on the post-money valuation, rather than stopping at the company's headline valuation, is what separates an accurate Series B expected-value estimate from a recruiter's conditional-payout pitch.